


前回インストール「過去記事:NagiosをYUMでインストール」したNagiosが出力するパフォーマンスデータをグラフ表示するアドオンであるPNP4Nagios(0.6.26)をンストールした際の備忘録です。

◆環境
VPS(CentOS7.9)
Nagios Core 4.4.6
Apache 2.4.46
PHP 7.4.23
PNP4Nagios 0.6.26
◆インストールドキュメント
PNP4Nagios公式ドキュメント
参考:CentOSで自宅サーバー構築「性能統計グラフ追加(Nagios+PNP4Nagios)」
◆ダウンロード
Nagiosは、YUMインストールしたが、PNP4NagiosはYUMでインストールすると古いバージョン(0.6.25)なので、ソースから(0.6.26)をインストールする。
Nagiosのインストールディレクトリは、YUMの場合「/etc」配下となる。
・必要パッケージ
# yum install rrdtool php-gd
PNP4Nagiosに必要なパッケージのインストール
・PNP4Nagios
# wget https://sourceforge.net/projects/pnp4nagios/files/PNP-0.6/pnp4nagios-0.6.26.tar.gz
# tar zxvf pnp4nagios-0.6.26.tar.gz
# cd pnp4nagios-0.6.26/
1行目:最新バージョンをダウンロード
2行目:ダウンロードファイルの展開
3行目:展開したディレクトリへ移動
◆インストール
# ./configure && make all && make fullinstall
# cd
# rm -rf pnp4nagios-0.6.26*
1行目:PNP4Nagiosのインストール
2行目:ディレクトリを抜ける
3行目:ダウンロードファイルおよび展開ディレクトリの削除
◆設定
・パスワードディレクトリ
# vi /etc/httpd/conf.d/pnp4nagios.conf
AuthUserFile /etc/nagios/passwd
1行目:httpdの「pnp4nagios.conf」設定ファイルの編集
2行目:パスワードファイルのディレクトリ指定を変更
・パフォーマンスデータ処理モード
パフォーマンスデータを処理するモードはいくつかあります。(参照:公式ドキュメント)
その中で、「Bulk Mode with NPCD」で設定します。
それぞれの設定要領についても公式ドキュメント「Configuration」にあります。
・PNP4Nagios設定
-日付表示形式設定
# vi /usr/local/pnp4nagios/etc/config_local.php

#
# Date format
#
$conf['date_fmt'] = "Y.m.d G:i";
1行目:「config_local.php」ファイルの編集
6行目:日付形式を変更
-プラグインの追加
# cp /usr/lib64/nagios/plugins/check_mem /usr/local/pnp4nagios/share/templates.dist/
# wget https://exchange.nagios.org/components/com_mtree/attachment.php?link_id=4105&cf_id=29  -O check_traffic.php
# mv check_traffic.php /usr/local/pnp4nagios/share/templates.dist/
1行目:前回の記事で不具合を修正しているプラグインと同じものなので、修正済みのプラグインをコピーして使用する
2行目: ネットワーク使用状況プラグインは、前回使用した「sh」ファイルではなく、「php」ファイルを使用するので新規にダウンロードする
3行目:ダウンロードした「check_traffic.php」を移動
-ネットワーク使用状況プラグインの編集
# vi /usr/local/pnp4nagios/share/templates.dist/check_traffic.php

<?php
$ds_name[1] = "Traffic Usage";
$opt[1] = "--vertical-label bits/s --title \"Traffic for $hostname / $servicedesc\" ";
1行目:「check_traffic.php」プラグインファイルの編集
4行目:表のタイトル「Traffic Usage」を追加
・Nagios設定
-「nagios.cfg」設定ファイルの編集
# vi /etc/nagios/nagios.cfg

process_performance_data=1

host_perfdata_command=process-host-perfdata
service_perfdata_command=process-service-perfdata

########## 2021.9.5 追加 ##########

#
# service performance data
#
service_perfdata_file=/usr/local/pnp4nagios/var/service-perfdata
service_perfdata_file_template=DATATYPE::SERVICEPERFDATA\tTIMET::$TIMET$\tHOSTNAME::$HOSTNAME$\tSERVICEDESC::$SE
RVICEDESC$\tSERVICEPERFDATA::$SERVICEPERFDATA$\tSERVICECHECKCOMMAND::$SERVICECHECKCOMMAND$\tHOSTSTATE::$HOSTSTAT
E$\tHOSTSTATETYPE::$HOSTSTATETYPE$\tSERVICESTATE::$SERVICESTATE$\tSERVICESTATETYPE::$SERVICESTATETYPE$
service_perfdata_file_mode=a
service_perfdata_file_processing_interval=15
service_perfdata_file_processing_command=process-service-perfdata-file

#
# host performance data starting with Nagios 3.0
#
host_perfdata_file=/usr/local/pnp4nagios/var/host-perfdata
host_perfdata_file_template=DATATYPE::HOSTPERFDATA\tTIMET::$TIMET$\tHOSTNAME::$HOSTNAME$\tHOSTPERFDATA::$HOSTPER
FDATA$\tHOSTCHECKCOMMAND::$HOSTCHECKCOMMAND$\tHOSTSTATE::$HOSTSTATE$\tHOSTSTATETYPE::$HOSTSTATETYPE$
host_perfdata_file_mode=a
host_perfdata_file_processing_interval=15
host_perfdata_file_processing_command=process-host-perfdata-file
1行目:「nagios.cfg」設定ファイルの編集
3行目:パフォーマンスデータ取得を有効化「0」→「1」
5行目:ホストパフォーマンスデータ取得コマンドをコメントアウトを解除して有効化
6行目:サービス パフォーマンスデータ取得コマンドをコメントアウトを解除して有効化
8行目以降:最終行にそれぞれのパフォーマンスデータに関するディレクティブを追加
追加したディレクティブ(hostも同様)
service_perfdata_file:パフォーマンスデータ一時ファイルのパス
service_perfdata_file_template:一時ファイルの形式。定義はNagiosマクロを使用
service_perfdata_file_mode:「a」オプションの指定で、データをファイルに追加する
service_perfdata_file_processing_interval:実行間隔(秒)
service_perfdata_file_processing_command:実行されるコマンド
-「commands.cfg」設定ファイルの編集
# vi /etc/nagios/objects/commands.cfg

#define command {

#    command_name    process-host-perfdata
#    command_line    /usr/bin/printf "%b" "$LASTHOSTCHECK$\t$HOSTNAME$\t$HOSTSTATE$\t$HOSTATTEMPT$\t$HOSTSTATETYPE$\t$HOSTEXECUTIONTIME$\t$HOSTOUTPUT$\t$HOSTPERFDATA$\n" >> /var/log/nagios/host-perfdata.out
#}


#define command {

#    command_name    process-service-perfdata
#    command_line    /usr/bin/printf "%b" "$LASTSERVICECHECK$\t$HOSTNAME$\t$SERVICEDESC$\t$SERVICESTATE$\t$SERVICEATTEMPT$\t$SERVICESTATETYPE$\t$SERVICEEXECUTIONTIME$\t$SERVICELATENCY$\t$SERVICEOUTPUT$\t$SERVICEPERFDATA$\n" >> /var/log/nagios/service-perfdata.out
#}

############### 2021.9.5 追加 ###############

define command {

       command_name    process-service-perfdata-file
       command_line    /bin/mv /usr/local/pnp4nagios/var/service-perfdata /usr/local/pnp4nagios/var/spool/servic
e-perfdata.$TIMET$
}

define command {

       command_name    process-host-perfdata-file
       command_line    /bin/mv /usr/local/pnp4nagios/var/host-perfdata /usr/local/pnp4nagios/var/spool/host-perf
data.$TIMET$
}
1行目:「commands.cfg」設定ファイルの編集
3~15行目:コメントアウトして、無効化
17行目以降:「nagios.cfg」で指定した実行コマンドの定義を追加
-「templates.cfg」設定ファイルの編集
# vi /etc/nagios/objects/templates.cfg

###############################################################################
#
# HOST TEMPLATES
#
###############################################################################

# Generic host definition template
# This is NOT a real host, just a template!

define host {

    name                            generic-host            ; The name of this host template
    notifications_enabled           1                       ; Host notifications are enabled
    event_handler_enabled           1                       ; Host event handler is enabled
    flap_detection_enabled          1                       ; Flap detection is enabled
    process_perf_data               1                       ; Process performance data
    retain_status_information       1                       ; Retain status information across program restarts
    retain_nonstatus_information    1                       ; Retain non-status information across program restarts
    notification_period             24x7                    ; Send host notifications at any time
    register                        0                       ; DON'T REGISTER THIS DEFINITION - ITS NOT A REAL HO
ST, JUST A TEMPLATE!
    action_url                      /pnp4nagios/graph?host=$HOSTNAME$' onmouseover="get_g('$HOSTNAME$','_HOST_')
" onmouseout="clear_g()"
}

###############################################################################
#
# SERVICE TEMPLATES
#
###############################################################################

# Generic service definition template
# This is NOT a real service, just a template!

define service {

    name                            generic-service         ; The 'name' of this service template
    active_checks_enabled           1                       ; Active service checks are enabled
    passive_checks_enabled          1                       ; Passive service checks are enabled/accepted
    parallelize_check               1                       ; Active service checks should be parallelized (disabling this can lead to major performance problems)
    obsess_over_service             1                       ; We should obsess over this service (if necessary)
    check_freshness                 0                       ; Default is to NOT check service 'freshness'
    notifications_enabled           1                       ; Service notifications are enabled
    event_handler_enabled           1                       ; Service event handler is enabled
    flap_detection_enabled          1                       ; Flap detection is enabled
    process_perf_data               1                       ; Process performance data
    retain_status_information       1                       ; Retain status information across program restarts
    retain_nonstatus_information    1                       ; Retain non-status information across program restarts
    is_volatile                     0                       ; The service is not volatile
    check_period                    24x7                    ; The service can be checked at any time of the day
    max_check_attempts              3                       ; Re-check the service up to 3 times in order to determine its final (hard) state
    check_interval                  10                      ; Check the service every 10 minutes under normal conditions
    retry_interval                  2                       ; Re-check the service every two minutes until a hard state can be determined
    contact_groups                  admins                  ; Notifications get sent out to everyone in the 'admins' group
    notification_options            w,u,c,r                 ; Send notifications about warning, unknown, critical, and recovery events
    notification_interval           60                      ; Re-notify about service problems every hour
    notification_period             24x7                    ; Notifications can be sent out at any time
    register                        0                       ; DON'T REGISTER THIS DEFINITION - ITS NOT A REAL SE
RVICE, JUST A TEMPLATE!
    action_url                      /pnp4nagios/graph?host=$HOSTNAME$&srv=$SERVICEDESC$' onmouseover="get_g('$HOSTNAME$','$SERVICEDESC$')" onmouseout="clear_g()"
}
1行目:「templates.cfg」設定ファイルの編集
24行目:Nagiosページのホスト(localhost)からPNPグラフ表示ページへのリンクを追加
62行目:ホストと同様に、サービスごとのリンクを追加
・サービス
各サービスを追加および再起動をします。
# chkconfig npcd on
# systemctl start npcd
# systemctl restart httpd
# systemctl restart nagios
1行目:「npcd」(Nagios-Perfdata-C-Daemon)の自動起動設定
2行目:「npcd」サービスの起動
3行目:「httpd」サービスの再起動
4行目:「nagios」サービスの再起動
◆確認
・インストールの確認
「https://SERVER_NAME/pnpnagios/」にアクセスして、「PNP4Nagios Environment Tests」を表示し、すべてのテストが緑(成功)する必要があります。
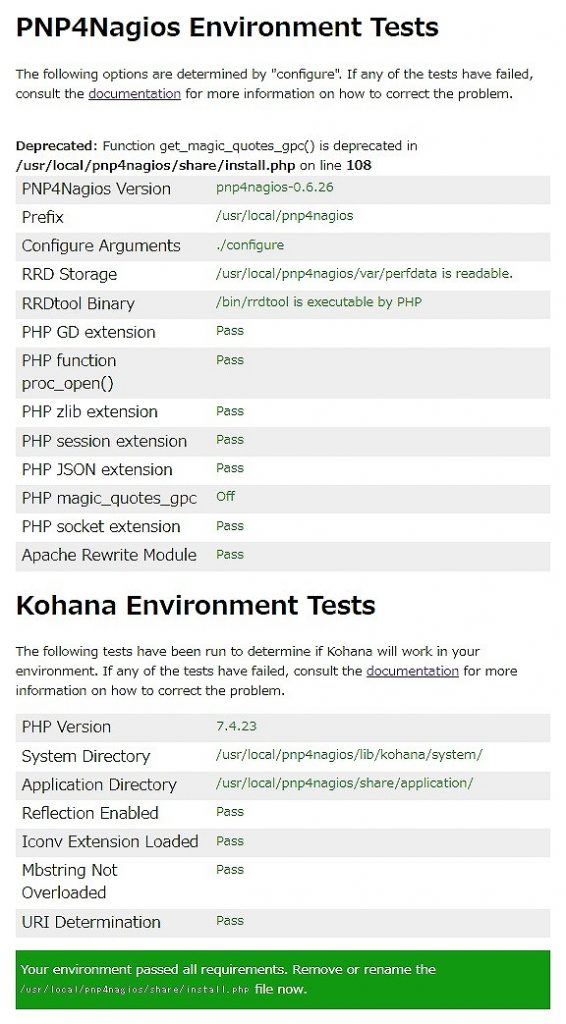
良ければ、テストページのファイルをリネームまたは削除し、Webインターフェイスページへのアクセスをできるようにします。
# mv /usr/local/pnp4nagios/share/install.php /usr/local/pnp4nagios/share/install.php.org
リネームする場合
・PNP環境の確認
PNPの環境(構成設定)の確認をするPerlスクリプト「verify_pnp_config」を使用します。
-ダウンロード
# wget http://verify.pnp4nagios.org/verify_pnp_config
「verify_pnp_config」スクリプトファイルをダウンロード
-使用方法
公式ドキュメント「verify_pnp_config」でも確認できます。
# perl verify_pnp_config -m bulk+npcd -c /etc/nagios/nagios.cfg -p /usr/local/pnp4nagios/etc/
オプションを指定(下記参照)し、perlで実行します。
オプション
-m | –mode=[ sync | bulk | bulk+npcd | npcdmod ]
-c | –config=[ nagios.cfgのファイルの場所(フルパス)]
-p|–pnpcfg=[ PNP設定ファイルの保存ディレクトリ ]
-o|–object=”[ host ][ ;service ]” (オプション)
出力情報
[INFO]:設定に関する情報
[OK ] :PNPの動作に影響なし
[WARN]:警告:PNPの動作に影響を与える可能性あり
[CRIT] :エラー:問題を解決しないとPNPは動作しない
[HINT] :ヒント:適切なドキュメントを確認する価値あり
[DBG] :デバッグメッセージ:問題の原因が判明する場合あり
◆エラー対処
・「Debug Logfile」の有効化
「process_perfdata.pl」の実行に際して、発生するエラーについては「Debug Logfile」を出力するように設定ファイルを変更して有効化する必要があります。
# vi /usr/local/pnp4nagios/etc/process_perfdata.cfg

#
# Name of the log file
#
LOG_FILE = /usr/local/pnp4nagios/var/perfdata.log

#
# Loglevel 0=silent 1=normal 2=debug
#
LOG_LEVEL = 2
1行目:「process_perfdata.cfg」設定ファイルの編集
6行目:ログファイルの出力場所の確認
11行目:ログレベルを変更し、出力を有効化「0」→「2」
・PHPエラー
PNPのグラフページを表示しようとした際にエラーページが表示された場合
-マジッククォート関数
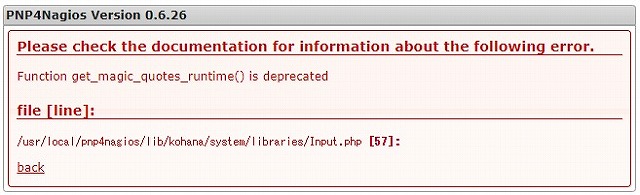
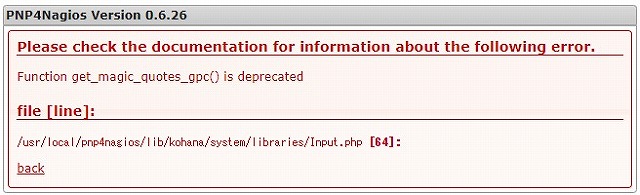
# vi /usr/local/pnp4nagios/lib/kohana/system/libraries/Input.php

// magic_quotes_runtime is enabled
if (@get_magic_quotes_runtime())

// magic_quotes_gpc is enabled
if (@get_magic_quotes_gpc())
1行目:エラー画面の「file [ line ]」で示されたファイルを編集
4行目:57行目のエラーに対し、関数名の前にエラー制御演算子である「@」を挿入し、エラーを非表示にする
7行目:64行目のエラーに対しても同様に対処
-sizeof()関数
「sizeof()」関数は、「count()」関数のエイリアスで、指定できない引数とした場合「E_WARNING」が発生します。
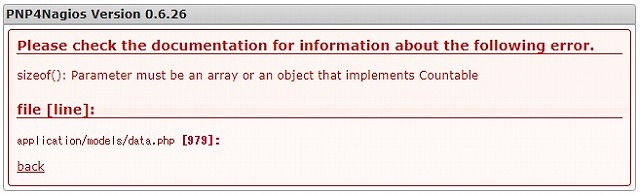
# vi /usr/local/pnp4nagios/share/application/models/data.php

    public function getFirstPage(){
        $pages = $this->getPages();
#        if(sizeof($pages) > 0 ){
        if(is_array($pages) && sizeof($pages)>0){
            return urldecode($pages[0]);
        }else{
            return FALSE;
        }
    }
1行目: エラー画面の「file [ line ]」で示されたファイルを編集
5行目:979行目のエラーをコメントアウト
6行目:5行目のエラーに対して、「is_array()」関数で変数の配列判定を「sizeof()」関数と「&&」論理積で結んで対処
PHPには、明るくないので対処法として正しいのか判断が付きませんが、エラーは出なくなり正常に動作はしています。
Nagiosに関する設定等についてはこれで落ち着きました。